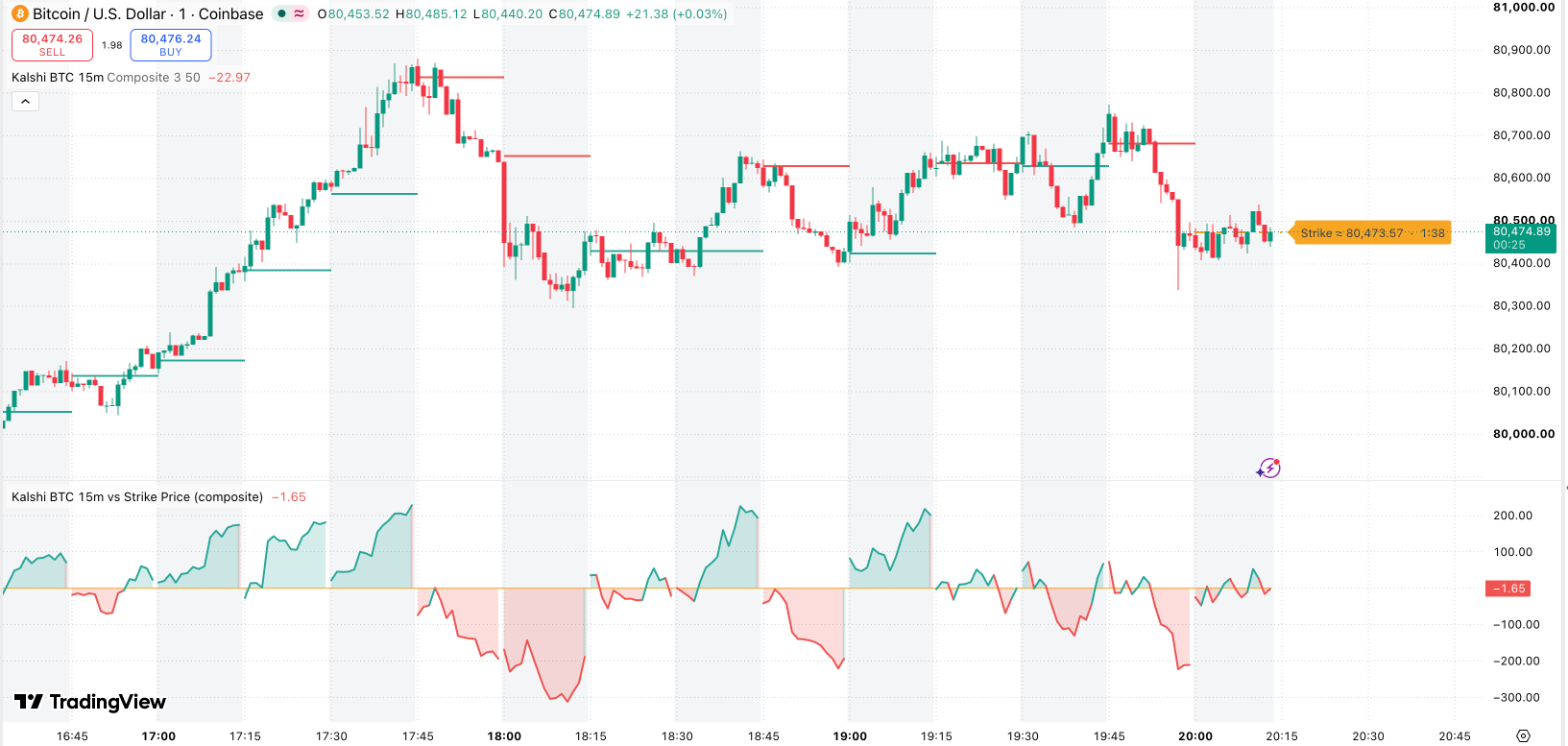
What the two indicators show
Kalshi BTC 15-Minute Window draws on the price chart:
- Each 15-minute window, with alternate windows shaded, so the chart lines up with Kalshi's market times.
- Each window's strike as a line. The current window's strike is dashed, with a label showing the strike and the time left.
- Past windows colored by result: green if bitcoin settled at or above the strike, red if below.
- A "vs strike" value in the legend: how many dollars bitcoin is above or below the current strike.
- Alerts for crossing the strike, being near it in the final minutes, and a new window opening.
Kalshi BTC 15m vs Strike Price (composite) sits in its own pane below the chart. The strike is the zero line, and bitcoin's distance above or below it is drawn in green or red. Each window starts a fresh line.
How to add them to TradingView
- Open a BTC/USD chart on TradingView at 1, 5 or 15 minutes.
- Open Pine Editor from the bottom toolbar.
- Replace the editor's contents with the window script or the distance script, and click Add to chart.
- Click Save to keep it in your TradingView account.
This works on TradingView's free plan. The source, install notes and license (MIT) are in the companion-indicators repository.
How the strike is approximated
Kalshi sets each window's strike to the average of CF Benchmarks' Bitcoin Real Time Index (BRTI) over the 60 seconds before the window opens. That is also the previous window's settlement value. TradingView doesn't carry BRTI, so the indicators average the one-minute prices of four of its constituent exchanges (Coinbase, Kraken, Bitstamp and Gemini) for that minute.
| Strike source | Median error | 90th percentile | Largest |
|---|---|---|---|
| Four-exchange composite (default) | $4.45 | $14.00 | $38.06 |
| Coinbase alone | $5.23 | $15.03 | $51.67 |
Measured against Kalshi's stated strike for 200 settled markets in November 2026. The green or red result color matched Kalshi's settled result in 195 of 199 windows.
Limits
- Near the strike, it can show the wrong side. A few dollars of error matters when bitcoin is a few dollars from the strike. Kalshi's market page is the authority.
- BTC/USD charts at 15 minutes or less only. On other symbols or longer timeframes the indicators show an error and draw nothing.
- No predictions. TradingView scripts can't fetch outside data, so these indicators know only the chart's price feeds. They show where bitcoin stands against the strike, not which side will win.
Common questions
Does the indicator show SpectralEdge's signals?
No. TradingView scripts can't fetch outside data, so the indicators work only from the chart's price feeds. They show the window, the strike and the distance to it, not a prediction.
Do I need a paid TradingView plan?
No. Adding a script from Pine Editor to your own chart works on TradingView's free plan.
Why can the strike differ from Kalshi's by a few dollars?
Kalshi uses CF Benchmarks' BRTI, which TradingView doesn't carry. The indicators average four of BRTI's constituent exchanges instead; across 200 markets the median difference was $4.45.